
How to find and solve urgent growth bottlenecks in 5 steps
TL;DR: This is a step-by-step walkthrough for start-ups and small businesses demonstrating how to track key marketing and sales metrics in real time across multiple channels, find your growth bottlenecks, identify opportunities, and create data-driven growth strategies. Minimise wasted effort and resources, and maximise your outputs by consolidating data across channels. By doing this founders and owners can set goals, measure performance, and adjust strategies efficiently. This method offers visibility, accountability, and better decision-making, helping businesses overcome growth challenges and optimise resources for sustained success.
Acquiring customers predictably, hiring the right people, minimising wasted effort, and maximising high leverage opportunities are often top priorities for founders and owners of any small business.
Operating a business is like driving a vehicle. You wouldn’t do so without a dashboard that tracks how much fuel you have in the tank, your mileage, or how fast you’re going. Vehicles can’t operate without a licensed operator (driver) and the right levers (pedals, clutch, gear stick). So why do so many founders and business owners run their business without these things? If you know you don’t have a dashboard in place, now’s a good time to start.
The first step to solving any growth problem….
Getting a clear, accurate, unfiltered picture of what’s actually going on in your business and where your rate-limiting steps are so that you can make highly informed strategic decisions. You need visibility.
If you’re like me, you believe what’s not measured is not managed. A big frustration I’ve had is lack of holistic data and visibility over what’s been happening across functions in my business that allow me to pinpoint where the root cause of our challenges are coming from, and directly address them. It’s difficult to make data driven decisions when the data is all over the place across various platforms, and not consolidated into a central hub.
I haven’t come across any adequate tools or resources that allow me to not only analyse historical marketing and sales data, but also set goals and targets across functions in a way that lets me see how one part of the machine relates to the other. For instance how social media content posts impact website traffic, and how website traffic impacts leads and sales. Quick-fire strategies and tactics have their place, but I believe that start-ups and small businesses need something more practical, so I built the solution. I call it the Growth Dashboard.
This tool allows you to track data across critical marketing and sales functions, identify key trends, and create informed strategies so you can allocate your time, effort, and resources effectively to maximise your growth opportunities. Read on if this sounds like something you need.
How many of these are you experiencing?
Start with the symptoms. If you’re primary goal is to grow and you’re hitting your head against the wall, you’re probably experiencing a series of the following;
❌ You’ve hit a revenue plateau, your sales aren’t growing, and you’re not sure what to do.
❌ You’re not generating enough qualified leads at the top of your funnel.
❌ You’re not sure how to get inbound leads predictably.
❌ You’re not sure which growth channels you should experiment with to solve this.
❌ You’re relying on word of mouth almost exclusively to generate new business.
❌ You’re not converting more than 25% of leads into customers.
❌ You don’t have a holistic view of all the data across your channels.
❌ You’re unable to make data driven decisions confidently because of this.
❌ Running your business feels like feast or famine, constantly switching between service delivery, admin, and sales growth.
❌ You’re not sure which role(s) to hire, how to hire them, what they should be doing, and how you’d measure success in their role.
If more than three of these are true for you, read on.
What happens if you don’t solve this?
Frankly, there are consequences for not having measures in place to set targets and measure results. These include;
❌ Making poorly informed decisions that lead to wasted resources and efforts.
❌ Losing out on crucial sales and partnership opportunities.
❌ Making painful bad hires which set you back several months, even years.
❌ Stress, anxiety, and burnout as a result of not having solutions.
❌ Burning through your cash reserves due to not generating revenue profitably.
❌ Ultimately, having to shut-up-shop because your business becomes unsustainable.
All of these are avoidable and can be mitigated if the right precautious and measures are taken to put controls into your business and start steering the ship intentionally. It’s a relatively small time investment from you as a leader, with a huge impact on the health and longevity of your business. Let’s dive in.
What is the growth dashboard?
This is a dynamic tool I created in Google Sheets that allows founders and business owners to set targets and track key growth metrics across marketing and sales channels and functions to make data informed decisions for revenue growth. Instead of taking wild guesses or employing ‘voodoo strategies’ based on anecdotes and vibes, use this to stay on top of your performance across channels and functions in real time and identify bottlenecks and opportunities as they occur.
Collaborate with your team, get to the root cause of your growth bottlenecks, and generate effective solutions. I built this as a founder, for founders. Not everyone is a data wizard, so I’ve done my best to make this tool accessible to people who aren’t as strong with numbers but want to be in control of their growth.


Features
✅ Metrics across a range of channels and operations including sales, marketing, website traffic, community, events, outreach, email newsletters, social media, paid ads, ambassador programmes, marketing budget, and lead magnets.
✅ Separate fields for goals and results for each metric, so you can compare your performance to your targets and adjust your tactics and strategies promptly to minimise wasted efforts and resources.
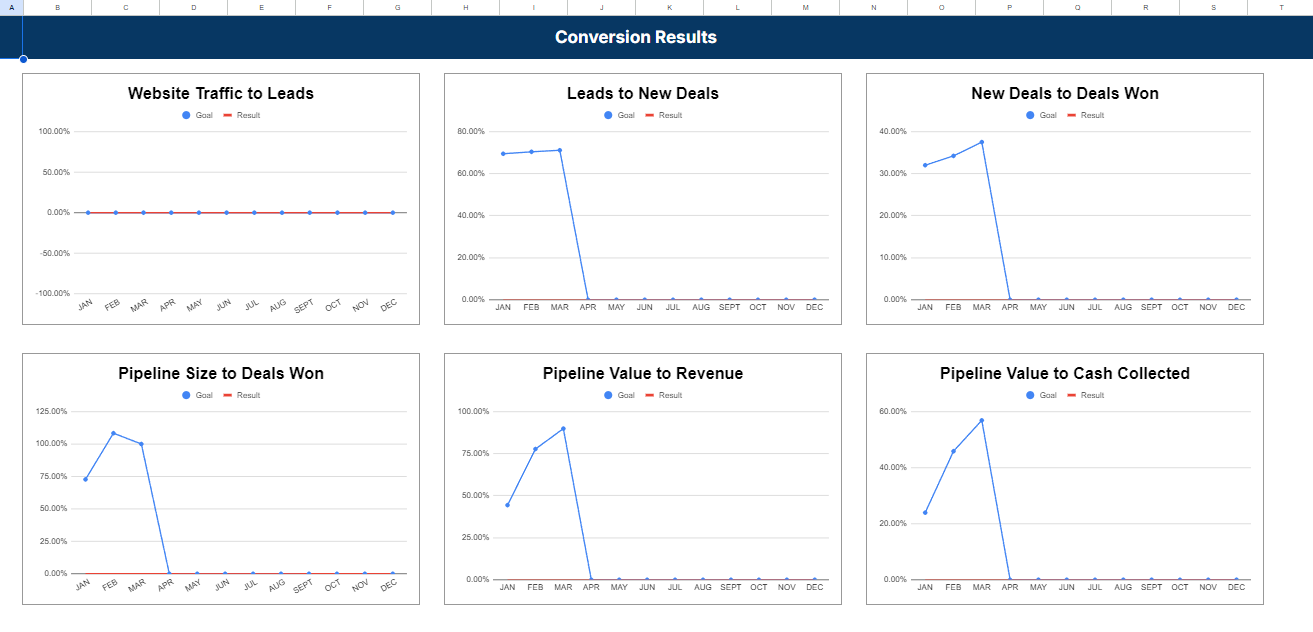
✅ Visualised dashboards to see your performance across channels at a glance. Avoid complex data analysis tasks when you just need to see what’s happening at a glance.
Benefits
✅ Better Decisions: Make high quality decisions in minutes, not hours or days. Get the holistic insights you need to make more accurate decisions.
✅ Visibility: Get a clear, accurate picture of what’s happening across channels with data.
✅ Accountability: If you have an individual or team in charge of a particular channel, measure their effectiveness at a glance and adjust your approach based on the numbers.
✅ Goal Setting: Set performance targets for marketing and sales functions in your business that are realistic and achievable.
WARNING!
If numbers are not your strong-suit, this might be overwhelming for you and seem difficult to implement at first. If that’s you, but you know this is crucial for your business, I encourage you to read until the end and reach out if you need support.
How it works
I’ll walk you through how to build your growth dashboard step-by-step. Follow these and you’ll end up with a crystal clear picture of how your business is performing, notable trends, which channels are working for you, and what levers you can pull to grow your business now.
Step 1. Define your KPI’s across channels
Step 2. Configure your scorecards and dashboards
Step 3. Test your dashboard
Step 4. Identify trends and patterns
Step 1. Define your KPI’s across channels
Build a glossary of Key Performance Indicators across your growth channels. This document serves as a source of truth for everyone involved in your growth strategy to refer to. Write out the definitions, formulas used to calculate the metrics, and how they are expressed (integer, percentage, or currency). Do this for as many relevant metrics as you can so that you have your foundations set.
You should have between 3 to 6 KPI’s per category. Categories include; executive metrics, sales mix, sales pipeline, marketing, website traffic, community, events, email newsletter, social media, cold email, paid advertising, referrals, marketing spend, and lead magnets.
Not all of these will be relevant to you, so choose the most high impact categories and metrics that you think will move the needle for your business. For instance, if you don’t have a community, don’t run events, and you don’t have a referral programme, you can ignore these unless you’re planning to launch them at some point in the near future.


Action Steps
Make a copy of the dashboard glossary sheet.
Fill out the fields for each relevant metric. Start with your Sales Mix, and move down the page.
Step 2. Configure your scorecards and dashboards
Next, you’ll make a copy of the growth dashboard for yourself and add your metrics to the relevant sheets and fields on your copy. You’ll notice some of the tabs have red highlights, and others have green highlights. Red tabs are sheets that you don’t make any changes to once your dashboard is configured. Green tabs are for data entry and they update the data in the red tabs automatically.
All sheets have a ‘Goal’ row which is your target for that particular month, and ‘Results’ row which is what you actually achieved. The ‘Goal %’ row calculates how far you exceeded or missed your goals by. If it’s below 100%, the text stays red. If it’s 100% or more, the text turns green.
Where necessary, you’ll link cells from one section of the sheet to another. For example, if you decide to have revenue generated on your executive scorecard for when you want to look at your overall growth performance at a glance, you would link it to the revenue generated rows on the sales scorecard so that you don’t have to re-enter a data set. Do this for all the relevant fields.
Update any conversion formulas accordingly (website traffic to form conversions for example). When you’ve done this, update the dashboards so that the graphs show you the correct visualised data.


Action Steps
Make a copy of the growth dashboard.
Replace the titles for each row in each sheet with your own metrics, starting with your sales mix and moving from left to right.
Update the format or formulas of the cells in each row accordingly.
Wherever data is duplicated, link the rows to each other.
Update the visual dashboards with the correct metrics.
Step 3. Test your dashboard
Start entering your data into your scorecards, starting with the sales mix moving from the left to the right. Make sure you’ve entered all the data correctly, and double check that all the formulas are functioning properly and generated the right results. For example, for fields calculating website traffic to form conversions, make sure it’s actually producing the correct figures using a calculator.


Action Steps
Go from left to right on all of the green tabs and enter data from the start of the calendar year, or the past six months. If possible, use actual data from your platforms so that you can start building a picture of how you’ve been performing right away.
Check to make sure that all the numbers are updating correctly and the visualised charts are reflecting the data accurately.
Identify discrepancies and correct any errors with formulas or tabs where you’ve connected datasets.
Step 4. Identify trends and patterns
Use the data you’ve entered to start building a picture and story of how your business has performed. Identify 1 to 3 notable trends for each channel and operation. For example, once you’ve completed the Sales Mix, check the Sales Mix dashboard to see the distribution of products and services you sold, and how it compares to the revenue you generated.
Look at your sales and marketing scorecards and see what traffic, lead generation, sales, and conversion trends and anomalies you can observe. For example, if you notice that there were two months where you had a spike or drop in sales, investigate why this happened. What event or occurrence triggered it?
Questions to ask when reviewing your data
Highlight anomalies: What triggered or prompted them?
Sales trends: What do you sell most of? Where does most of your revenue come from? What are your conversion rates and average sale value?
If sales increased or decreased, when did it happen and why? What were the surrounding circumstances?
How many inbound enquiries and leads did you get? What was the conversion rate into sales? How long is the average sale cycle?
How much traffic did you get, and what percentage of visits converted into enquiries?
If you’re not getting much sales or traffic, what levers can you pull to generate more traffic and leads? Can you write blog posts? Create lead magnets? Create and share free content?
Which channels and content have worked the best so far for growing your audience, increasing awareness, generating traffic, and driving sales? What are your numbers telling you?
Are there any opportunities to minimises wasted effort and resources? Is there any low-hanging fruit in the form of warm lists, contacts, and past clients you can leverage?
Have you got the right audience + offer + messaging mix to increase traffic and decrease CAC (Customer Acquisition Cost)
What would it take to grow your revenue by 5x to 10x in 90 days?
Step 5. Highlight bottlenecks using the Traffic Light System
Every business has five core functions; Lead Generation, Lead Nurture, Sales, Fulfilment & Service Delivery, and Retention / Resell / Upsell.
Lead Generation:
Creating awareness of your business and your solutions. Building your audience. Generating traffic, enquiries and appointments.
Lead Nurture (Marketing):
The goal for marketing is to educate your audience about the pain and problems that they have.
Invite your audience to talk to you about their problem.
Sales
Qualifying leads, turning them into prospects and in turn, paying customers.
Fulfilment/ Service Delivery
Delivering the product/ service to the customer. Fulfilling on the promises that were made. Making sure our customers are happy.
Retention / Resell / Upsell
Getting customers to purchase another product or service from us, or buying the same product or service from us again.
Use your insights to score how you’re performing on each function using the traffic light system. Green meaning it’s performing well, yellow is moderate, and red means it needs attention.
Outcomes you can expect
Once your dashboard is set up you should be able to quickly pinpoint where your growth bottlenecks and opportunities are and make an informed decision as to where you need to focus your attention. You should do nothing else but solve the bottleneck your experiencing, or exploit the biggest opportunity that presents itself.
Now you can
✅ Set goals, targets, and quotas across growth channels and operations.
✅ Pinpoint your revenue growth bottlenecks and opportunities at a glance.
✅ Track how your marketing and sales efforts are performing against your targets.
✅ Adjust your strategies and reallocate promptly based on data, minimising wasted effort.
✅ Gain a higher level of visibility and control of your businesses growth channels.
✅ Reduce your anxiety around lead generation and sales and produce more effective, considered growth strategies that get results.
Ready to take control?
The dashboard is available to download with a series a walkthrough videos you can follow to build your own from scratch. Alternatively, if you’re not too confident with numbers and spreadsheets or don’t have time, I can build it for you.
Build it yourself
Get the Growth Dashboard template and glossary to set it up on your own. Use the step-by-step guides and tutorial videos to configure everything according to your business needs. You’ll also receive lifetime access to all future updates, ensuring your dashboard stays relevant as your business grows.
Build it with me
Collaborate with me in personalised video calls to configure your dashboard. Together, we’ll identify your key growth metrics, uncover bottlenecks, and develop actionable strategies. This hands-on support ensures you get a customised dashboard that aligns with your goals.
Built for you
I’ll handle everything—from setting up the dashboard to delivering an insights report. Share your data, and I’ll create a fully customized Growth Dashboard that highlights bottlenecks, tracks performance, and delivers actionable recommendations for your growth strategy.
Join the waitlist and pre-order your copy of the growth dashboard today. The final version will be available for download from September 30th.